Heavy rain hazard maps
The engineering firm Sönnichsen & Weinert has drawn up heavy rainfall maps for the entire city area for the city of Bocholt as part of the project "Hochwasserallianz Bocholter Aa". These are based on standardised basic assumptions that apply to the development of heavy rainfall maps in NRW.
This means: Assuming that the entire city area is evenly sprinkled for one hour, it was simulated how the water is distributed and where it accumulates. These calculations are carried out for various defined scenarios, of which the most relevant for residents are published here.
In the so-called scenario 2, the assumption is that in an exceptional precipitation event, a precipitation amount of 42.3 mm per hour (equivalent to 42.3 l per square metre and hour) will fall on Bocholt. In scenario 3, an extreme precipitation event results in 90 mm per hour (corresponding to 90 l per square metre and hour).
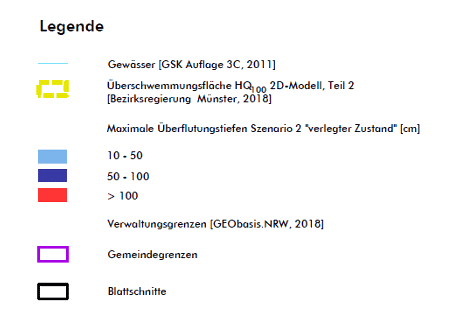
The highest water level reached under the above-mentioned conditions in the rainfall period of one hour is shown on the maps with the flooding depths resulting from the scenarios.
The colour indicates how high the highest water level was: areas coloured light blue mean that the water was dammed up to a height of 10 to 50 cm at this point. Dark blue areas are 50 to 100 cm and red coloured areas are water depths of more than one metre. These values can also be found in the corresponding legend.
My house is in a coloured area - what now?
If your house is located in one of the coloured areas, this is an indication that it may be exposed to a hazard during such heavy rainfall events and that damage could potentially occur as a result. Whether this actually occurs in reality varies from house to house and must be assessed individually.
This is partly due to the fact that the resolution of the models is limited and thus, for example, lower enclosing walls, kerbs, upstands etc. cannot be taken into account in the simulation.
Concrete recommendations for action can be found on the homepage of the Flood Alliance.
- Überflutungsausdehnungskarte pdf 18,02 MB
- Überflutungsausdehnungskarte (pdf 18,02 MB) download
- Überflutungstiefen Übersicht (Szenario 2) pdf 3,38 MB
- Überflutungstiefen Übersicht (Szenario 2) (pdf 3,38 MB) download
- Überflutungstiefen Detail (Szenario 2) pdf 19,95 MB
- Überflutungstiefen Detail (Szenario 2) (pdf 19,95 MB) download
- Überflutungstiefen Übersicht (Szenario 3) pdf 3,62 MB
- Überflutungstiefen Übersicht (Szenario 3) (pdf 3,62 MB) download
- Überflutungstiefen Detail (Szenario 3) pdf 20,39 MB
- Überflutungstiefen Detail (Szenario 3) (pdf 20,39 MB) download


